8 Useful JavaScript Libraries to Build Interactive Charts
Presentations often involve a lot of data which needs to be conveyed to clients. But making others understand raw data might be a tad bit difficult as not everyone has the same understanding of data. One of the easiest ways to deal with this problem is to make them understand data with the help of charts. JavaScript makes charts interesting by allowing users to add animations. With the help of JavaScript designers can now make charts interactive and playful. We’ve tried to gather some of the best JavaScript libraries to build interactive charts to make the job even easier for designers.
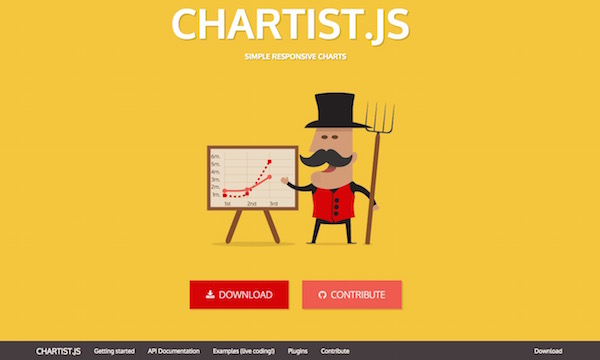
1. Chartist.js
Chartist JS is one of the most interesting JavaScript chart libraries available. Chartist JS uses SVG for the formation of the interactive charts. Apart from being interactive, another interesting feature of this library is its flexibility created by the use of CSS and JavaScript for styling and controlling. It offers users loads of animation options via the Chartist Animation API and SMIL and also allows easy customization with the help of SASS files.
2. Peity
Peity is an excellent jQuery plugin which allows the insertion of mini charts into the web page a designer creates. Whether it’s a line, bar, donut or pie chart, all a designer needs to do is create the element and specify the value and Peity will convert it into the desired chart. Initially the charts are available in small sizes, but now they can be customized to get the desired length, breadth and width. It also gives an option to play with the colors on the chart.
3. DC.js
As DC JS uses D3 libraries to create charts, so it allows designers to create charts which have the option of interacting with an audience. It is useful for creating charts for both desktop and mobile browsers. Whether it’s a simple or highly complex chart, DC JS does it with ultimate ease.

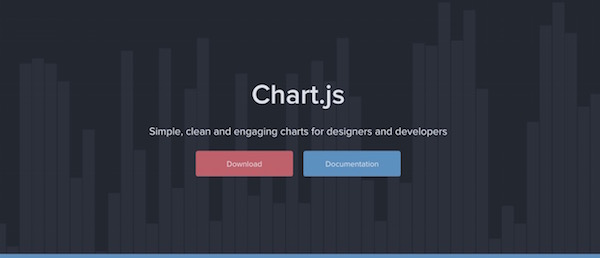
4. Chart.js
Charts.js allows the formation of various types of charts including line, donut, pie to bar, radar and polar area charts. Easy customization of size and color of the charts allows designers to make charts which suit their needs. The charts are also responsive and the library allows designers to use exactly the chart they need which prevents the clogging of a site with unnecessary charts.
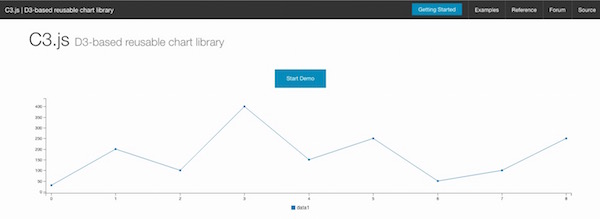
5. C3.js
C3.js is based on D3.js libraries and has all the codes included so designers can just put the data in and there’s no need to write the codes. The various API s of C3 JS allow for easy customization of the charts which range from line charts to gauge charts. It uses CSS which allows designers to make their own customized charts.  All designers need to do is insert the specifications.
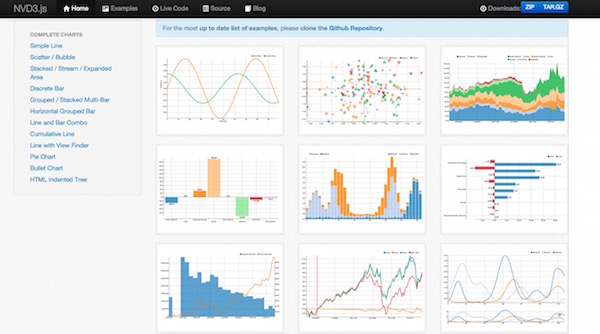
6. NVD3
This library built on D3 JS, NVD3 allows the reuse of charts. The library is composed of a set of templates which makes building charts whole lot easier.
7. Flot
This jQuery plugin comes with various kinds of charts which works well with HTML canvases. Flot allows panning and zooming, data point interaction and allows the switching on and off of certain aspects among others. There are also some plugins which designers can use at their convenience.

8. EChart
EChart is a JavaScript chart library which allows plotting of as many as 200,000 points. It allows easy extraction, integration and exchanging of data among various charts.
We hope these JavaScript libraries for making charts is a help. Among the huge array of JavaScript chart libraries, we’ve picked the best ones available to allow users to design with ease.